
How to Interpret the Stress-strain Curve of GR2 Titanium Wire?
- Gr2 Titanium Wire
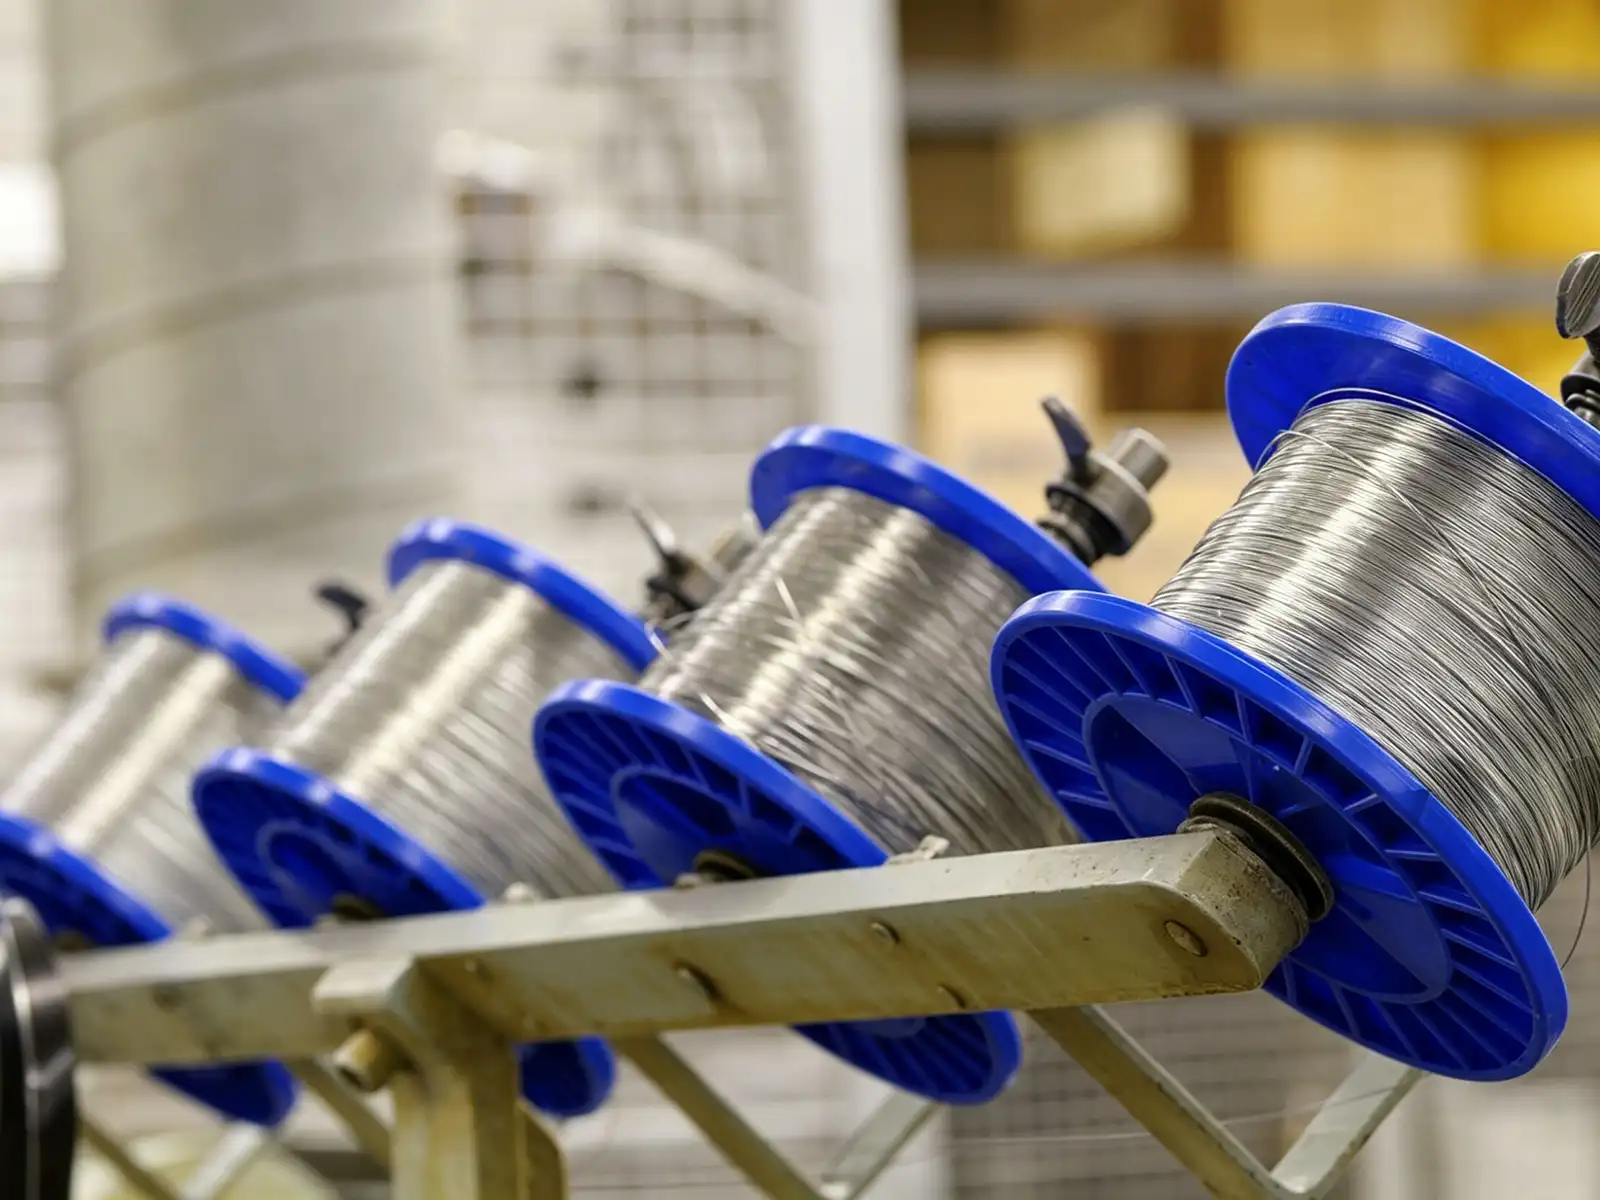
The stress-strain curve of GR2 titanium wire is the core basis for evaluating its mechanical properties and processing adaptability. This curve visually presents the complete behavior characteristics of the material from elastic deformation to plastic deformation to fracture during the stress process. By accurately interpreting key parameters such as the elastic modulus, yield plateau, strain hardening zone and fracture point on the curve, engineers can determine whether the titanium wire meets the strength requirements, forming performance and fatigue life expectations under specific working conditions. Mastering the curve interpretation method can help manufacturers optimize processing process parameters, help purchasers accurately select materials, and avoid product failure or cost waste due to misjudgment of material properties. This is particularly critical for high-demand application scenarios such as chemical anti-corrosion, marine engineering, and medical equipment.
1. What Should You Know About the Basic Structure and Physical Meaning of Stress-strain Curve?
(1) What Should You Know About Four Typical Stages of the Curve?
GR2 titanium wire showed obvious segmentation characteristics in the tensile test. The elastic deformation stage shows a linear relationship. At this time, the stress is proportional to the strain, and the material can completely return to its original shape after unloading. The yield stage marks the beginning of permanent deformation of the material, with slight fluctuations in stress but rapid increase in strain. In the strain hardening stage, the material regains its load-bearing capacity through dislocation proliferation, and the curve rises again until it reaches the peak tensile strength. In the necking fracture stage, the local cross-sectional area decreases sharply, and the stress decreases nominally, but the real stress continues to increase until fracture.
(2) Why Is Engineering Value of Elastic Modulus Important?
The slope of the initial section of the curve is the elastic modulus, and the typical value of GR2 titanium wire is about 103-110 GPa. This parameter determines the stiffness performance of the wire in the elastic range, which directly affects the rebound characteristics of spring parts and the deformation control accuracy in precision instruments. Compared with stainless steel (approximately 193 GPa), the lower elastic modulus of titanium wire means greater elastic deformation under the same stress, which actually becomes an advantage in scenarios that require flexible connections or shock absorption and buffering.
(3) What Should You Know About the Practical Implications of Yield Strength?
The yield point marks the safe limit of a material’s load-bearing capacity. The yield strength of GR2 titanium wire is usually in the range of 275-420 MPa. This value determines whether the wire can maintain dimensional stability during welding, cold drawing forming or long-term load bearing. The yield platform of titanium wire in the annealed state (M state) is obvious, making it easy to identify safe working stress; in the semi-hard state (Y2 state) and hard state (Y state), the yield point moves upward due to the strain hardening effect, and the strength is increased but the plastic reserve is correspondingly reduced.
2. What Are the Differences in Comparison of Curve Differences Under Different Heat Treatment Conditions?
(1) What Should You Know About Curve Characteristics of Annealed Titanium Wire?
The annealed GR2 titanium wire has been fully recrystallized, the internal stress is completely released, and the grains are in a uniform and equiaxed state. Its stress-strain curve shows a long yield plateau (about 2-3% strain range), followed by a stable strain hardening stage. The tensile strength is concentrated at 400-500 MPa, the elongation can reach 15-20%, and the necking phenomenon is obvious during fracture. Titanium wire in this state is particularly suitable for applications that require deep forming, such as complex-shaped braided meshes, medical sutures, or assembly processes that require multiple bends.
Heat treatment status | Yield strength (MPa) | Tensile strength (MPa) | Elongation (%) | Hardness(HV) |
Annealed state (M) | 275-420 | 400-500 | 15-20 | 140-200 |
Semi-hard state (Y2) | 480-620 | 480-620 | 8-12 | 180-240 |
Hard state(Y) | 550-750 | 550-750 | 5-8 | 220-300 |
(2) What Should You Know About Strength Improvement Mechanism of Semi-hard and Hard States?
Cold drawing deformation causes a significant increase in dislocation density, and the grains are elongated along the drawing direction to form a fibrous structure. The yielding phenomenon of semi-hard titanium wire becomes less obvious, the curve shows continuous transition characteristics, the tensile strength increases to 480-620 MPa, but the elongation drops to 8-12%. The hard titanium wire is further strengthened and the tensile strength can reach 550-750 MPa. At this time, the material is already in a high strain hardening state and only 5-8% of the plastic reserve is left. There are trade-offs in engineering applications: load-bearing fasteners are preferably in a hard state to obtain high strength, while welding filler wire must be in an annealed state to ensure the fluidity of the molten pool.
(3) What Should You Know About Effect of Heat Treatment on Fatigue Properties?
The area under the envelope of the curve represents the toughness reserve of the material, which is directly related to the fatigue life. Annealed titanium wire has sufficient plasticity and can disperse stress concentration through microscopic plastic deformation under cyclic loading, so the fatigue crack initiation rate is slow. Although hard titanium wire has high strength, its brittleness increases, and cracks are prone to rapidly propagate at defects under vibration environments or impact loads. For components that are subject to alternating stress, such as marine mooring ropes and chemical equipment springs, annealed or slightly semi-hard titanium wire should be preferred.
3. What Should You Know About Correlation Between Curve Parameters and Actual Machining Performance?
(1) What Should You Know About Elongation and Forming Limit?
The elongation value reveals the maximum amount of plastic deformation a material can withstand before breaking. The 15-20% elongation of GR2 titanium wire in the annealed state means it can withstand large bending radius compression, drawing reduction or braiding torsion without cracking. When titanium wire needs to be wound into a coil with a diameter less than 10 times its own diameter, the elongation rate below 12% often leads to microcracks on the surface. In the production of eyeglass frames, the complex bending of the nose pads requires the titanium wire elongation to be no less than 15%; while linear structural parts such as the fixed rods of chemical tower internals can accept semi-rigid materials.
(2) What Should You Know About Predictive Role of Strain Hardening Index?
The slope of the curve in the strain hardening region reflects the work hardening tendency of the material. The strain hardening index of GR2 titanium is about 0.05-0.10, which is a low level and is determined by the characteristics of pure titanium. This means that during the cold working process, the material strength increases more slowly and the plasticity reserve remains better. When designing the multi-pass drawing process, the deformation distribution of each pass can be calculated based on the hardening index: controlling the single diameter reduction rate at 15-20% can not only achieve the ideal tissue refinement effect, but also avoid the risk of wire breakage due to excessive hardening. In contrast, TC4 alloys with higher strain hardening index (approximately 0.05-0.08) require more frequent intermediate annealing to restore plasticity.
(3) What Should You Know About Area Shrinkage and Material Purity?
The area shrinkage rate during fracture can indirectly reflect the internal defects of the material. High-purity GR2 titanium wire (oxygen content ≤ 0.20%) usually shows a reduction of area of 50-60%, and the fracture surface shows a typical dimple morphology. Abnormally low shrinkage (<40%) often indicates the presence of inclusions, pores, or component segregation. Through vacuum smelting and multi-pass rolling, single impurity elements can be controlled below 0.10%, and total impurities are <0.40%, ensuring that the titanium wire maintains good microscopic uniformity under extreme stretching, which is crucial for zero-defect requirements scenarios such as medical implants and aerospace fasteners.
4. What Should You Know About the Influence of Environmental Factors on Curve Shape?
(1) What Should You Know About Temperature Effects and High Temperature Performance Evaluation?
The standard curve measured at room temperature cannot fully represent the performance of titanium wire at actual service temperatures. The tensile strength of GR2 titanium decreases slightly (about 5-8%) at 100℃, but the elongation increases by 10-15%, and the material shows better plasticity. When the temperature rises to 300℃, the yield strength and tensile strength drop to 70% and 75% of the room temperature values respectively. At this time, the strain hardening stage of the curve becomes gentle and the material is more prone to creep. When designing titanium wire fasteners for chemical reactors, the safety factor must be checked based on the real curve data at operating temperature to avoid relaxation failure caused by insufficient estimation of the temperature reduction coefficient.
(2) What Should You Know About Weakening Effect of Corrosive Media?
The stress corrosion environment will significantly change the fracture mode of titanium wire. GR2 titanium exhibits ductile fracture characteristics under pure tensile load, but when a sustained stress of 70% of the yield strength is applied in an acidic solution containing chloride ions, the material may undergo brittle cracking at a level far below the normal fracture strength. This phenomenon is manifested as a sudden drop in elongation on the stress-strain curve, the fracture point appears early, and the fracture surface exhibits cleavage plane characteristics. When selecting titanium wire for marine engineering, it is necessary to combine the critical stress intensity factor obtained by the slow strain rate tensile test (SSRT) instead of simply relying on the standard curve measured in the air.
(3) What Should You Know About Strain Rate Sensitivity Analysis?
There are obvious differences in the curve shape of GR2 titanium wire under quasi-static tension (strain rate 10⁻³/s) and impact load (strain rate 10³/s). At high strain rates, the yield strength increases by 15-25%, but the elongation decreases by about 20%, and the material exhibits a strain rate strengthening effect. This characteristic is particularly critical during the rapid cooling process of the welding heat-affected zone: the weld metal undergoes instantaneous high strain rate deformation. If the base material titanium wire itself has insufficient toughness reserves, it is easy to produce microcracks under the action of thermal stress. By optimizing the composition ratio of the welding wire, it is possible to ensure that the impact elongation of more than 12% is maintained even under rapid solidification conditions, thereby ensuring welding quality.
5. Why Is Application Practice of Curve Data in Quality Control Important?
(1) What Should You Know About Statistical Assessment of Batch Stability?
In industrial production, the stress-strain curves of titanium wires of the same specifications should be highly consistent. Using the statistical process control (SPC) method, 5-10 randomly selected samples from each batch are subjected to tensile testing, and control charts for tensile strength, yield strength and elongation are drawn. When a batch of data points exceeds the 3σ control limit or a continuous 7-point unilateral deviation occurs, the process review process is immediately initiated to trace variables such as annealing temperature, cold drawing rate or lubricant type. This strict curve data monitoring allows product performance fluctuations between batches to be controlled within ± 3%, which is far better than the industry’s normal level of ± 8%.
quality index | Standard requirements (refer to ASTM B863) | actual control level | industry average |
Tensile strength fluctuations | ± 5% | ± 3% | ± 8% |
Elongation fluctuation | ± 15% | ± 8% | ± 20% |
Diameter tolerance | ± 0.05mm | ± 0.02mm | ± 0.08mm |
Surface defect rate | <2% | <0.5% | About 3-5% |
(2) What Should You Know About Non-destructive Testing and Curve Prediction Model?
Eddy current testing and ultrasonic flaw detection can evaluate the internal quality without damaging the titanium wire, but require a correlation model with the tensile curve data. Through machine learning training on more than 1, 000 sets of samples, the tensile strength can be predicted based on the characteristic parameters of the eddy current signal (phase angle, impedance change rate), with an accuracy of ± 15 MPa. It is worth noting that the parameters provided by the stress-strain curve itself (such as elastic modulus, yield strength) are the basic inputs for model training, and the eddy current signal achieves prediction by indirectly correlating these curve parameters. This makes 100% online inspection possible: every titanium wire shipped from the factory has been eddy current scanned, and the system automatically eliminates products that do not meet the predicted strength. Qualified wire comes with a predicted performance report, based on which customers can optimize process parameters such as welding current or forming pressure.
(3) What Should You Know About Curve Traceback in Failure Analysis?
When a titanium wire fracture accident occurs on site, supplementary tensile testing on the remaining section can restore the true state of the material. There has been feedback from chemical companies that titanium wire fasteners suddenly broke after 6 months of service. The stress-strain curve of the sample submitted for inspection showed that the elongation was only 4%, and there was an obvious source of stress corrosion cracking at the fracture surface. Comparing the original delivery status (elongation 18%), it was determined that the performance degradation was caused by hydrogen embrittlement. Further analysis found that the company’s pickling process did not strictly control the HF concentration and soaking time, resulting in hydrogen absorption on the surface of the titanium wire. By optimizing the pickling formula and adding the hydrogen removal annealing process, similar failures did not occur in subsequent batches. The curve data played a key role in root cause analysis.
6. How Should Material Selection Decision-making Framework Based on Curve Characteristics?
(1) Why Is Selection Logic for Intensity-driven Applications Important?
When the design load is close to the material limit, priority should be paid to the tensile strength and yield strength values. Scenarios such as the mooring cables of deep-sea detectors and the sealing gaskets of high-pressure reactors require titanium wires to withstand high stress under small deformation. In this case, semi-hard or hard materials should be selected. However, attention should be paid to the risk of brittleness caused by increased strength: the elongation of hard titanium wire is only 30-40% of that in the annealed state. If there is a possibility of sudden overload under working conditions, the stress concentration coefficient must be verified through finite element analysis. If necessary, the annealed state can be used in key parts and the cross-sectional area can be increased.
(2) Why Is Evaluation Criteria for Plasticity-dominated Applications Important?
Products such as medical sutures, flexible sensor leads, and complex braided meshes have strict requirements on elongation. For such applications, annealed GR2 titanium wire should be selected, and the supplier should be explicitly asked to provide the stress-strain curve of a single wire rather than the batch average. Because even within the same batch, titanium wires at different coil positions may have elongation fluctuations of 5-8% due to differences in cooling rates. For customers with high plasticity requirements, customized services can be launched, promising that the elongation of each wire is ≥ 18% and the curve shape consistency is <3% coefficient of variation. Although the price increases by about 12%, it significantly reduces the customer’s processing scrap rate.
(3) What Should You Know About Comprehensive Performance Balanced Engineering Compromise?
Most application scenarios require finding the best balance between strength, plasticity, and cost. Standard annealed GR2 titanium wire has become the first choice in chemical anti-corrosion, marine engineering and other fields with its moderate strength of 400-500 MPa and good plasticity of 15-20%. The yield platform of its stress-strain curve is clear, making it easier for designers to determine the safe working stress (usually 60% of the yield strength); the strain hardening stage is stable, ensuring that the material still has plastic buffering capabilities in the event of accidental overload. For demanding aerospace parts, 5-8% pre-strain can be applied based on the annealed state, and work hardening can be used to increase the strength to 480 MPa while retaining 12% elongation to achieve customized performance.
Application areas | Recommended status | Key curve parameters | Typical specifications |
Welding filler | Annealed state (M) | Elongation ≥ 18% | φ1.0-3.0mm |
spring assembly | Semi-hard state (Y2) | Yield strength>400MPa | φ0.5-2.0mm |
fastener | Hard state(Y) | Tensile strength>550MPa | φ3.0-6.0mm |
medical device | Annealed state (M) | Elongation ≥ 20% | φ0.3-1.5mm |
7. What Should You Know About Summarize?
The stress-strain curve of GR2 titanium wire is a bridge connecting the microstructure and macroscopic properties of materials. Accurate interpretation of the characteristics of each stage of the curve can guide the optimization of heat treatment processes, setting of processing parameters and prediction of failure risks. The differences in curve shapes corresponding to different heat treatment states essentially reflect the comprehensive effects of dislocation density, grain size and texture distribution. In engineering applications, factors such as temperature, corrosive medium, and strain rate of actual working conditions should be combined to select the material state that best matches the standard curve, and batch stability should be ensured through statistical quality control, so that the performance advantages of GR2 titanium wire can be fully utilized.
FAQ
Q1, Why Do the Stress-strain Curves Provided by Different Suppliers Differ Greatly for Titanium Wires Also Marked GR2?
The shape of the curve is affected by many factors such as raw material purity, total cold drawing deformation, annealing temperature and holding time. In order to reduce costs, some suppliers use raw materials with lower grades of sponge titanium, or omit the intermediate annealing process, resulting in uneven grain size and high residual stress, which is ultimately reflected in the curve as blurred yield points and low elongation. When selecting, the supplier should be required to provide spectral analysis reports and heat treatment records to verify process standardization.
Q2: Does the high strength of hard titanium wire mean better fatigue performance?
This is a common misunderstanding. Although the tensile strength of hard titanium wire can reach 750 MPa, the toughness envelope area under its stress-strain curve is significantly reduced, and cracks are more likely to initiate at surface micro-defects under cyclic loading. Fatigue life mainly depends on elongation and area reduction. The annealed material performs better in a vibration environment due to its sufficient plastic reserve. The typical fatigue strength can reach 45-50% of the tensile strength.
Q3: How to judge whether titanium wire is suitable for a specific welding process through the stress-strain curve?
When welding filler wire, you need to focus on the yield plateau length and elongation value of the curve. The ideal welding wire should have an obvious yield platform (≥ 2% strain), which ensures that the molten pool metal has sufficient plastic coordination stress during solidification shrinkage to avoid thermal cracks. The elongation should be no less than 15% to ensure that the weld will not break brittlely when subjected to restraining stress during the cooling process. The composition of ERTi-2 welding wire is fine-tuned to achieve an elongation of 18% while maintaining a yield strength of 345 MPa, meeting the requirements of various welding methods such as TIG and MIG.
How Should Looking for Reliable GR2 Titanium Wire Supplier?
A professional manufacturer is equipped with a continuous rolling production line from Italy’s Danieli, with an annual production capacity exceeding 10, 000 tons. It provides full specifications of φ0.1-6.5mm titanium wire and customized surface treatment services. Each batch of products comes with measured stress-strain curve data and EN 10204 3.1 material certificate. Welcome to send technical requirements to: sales@titaniumvalleys.com to obtain detailed specifications and sample support.
References
- Li Minghua, Zhang Jianguo. Research on the relationship between mechanical properties and microstructure of industrial pure titanium [J]. Rare Metal Materials and Engineering, 2021, 50(3): 1024-1031.
- Wang Dongsheng, Liu Qing. Effects of cold deformation and annealing processes on the structure and properties of GR2 titanium wire [J]. Progress in Titanium Industry, 2020, 37(2): 28-33.
- Zhang Zhigang, Wang Junfeng. Titanium and titanium alloy welding technology and applications[M]. Beijing: Metallurgical Industry Press, 2019: 156-178.
- Chen Lixin, Zhao Hongwei. Research on the application of stress-strain curve in material quality control [J]. Mechanical Engineering Materials, 2022, 46(5): 45-51.
- Li Wei, Yang Jianhua. Research progress on the impact of environmental factors on the mechanical properties of industrial pure titanium [J]. Corrosion Science and Protection Technology, 2021, 33(4): 367-374.