
What Is the Density of Gr5 Titanium Bar
- Gr5 Titanium Bar
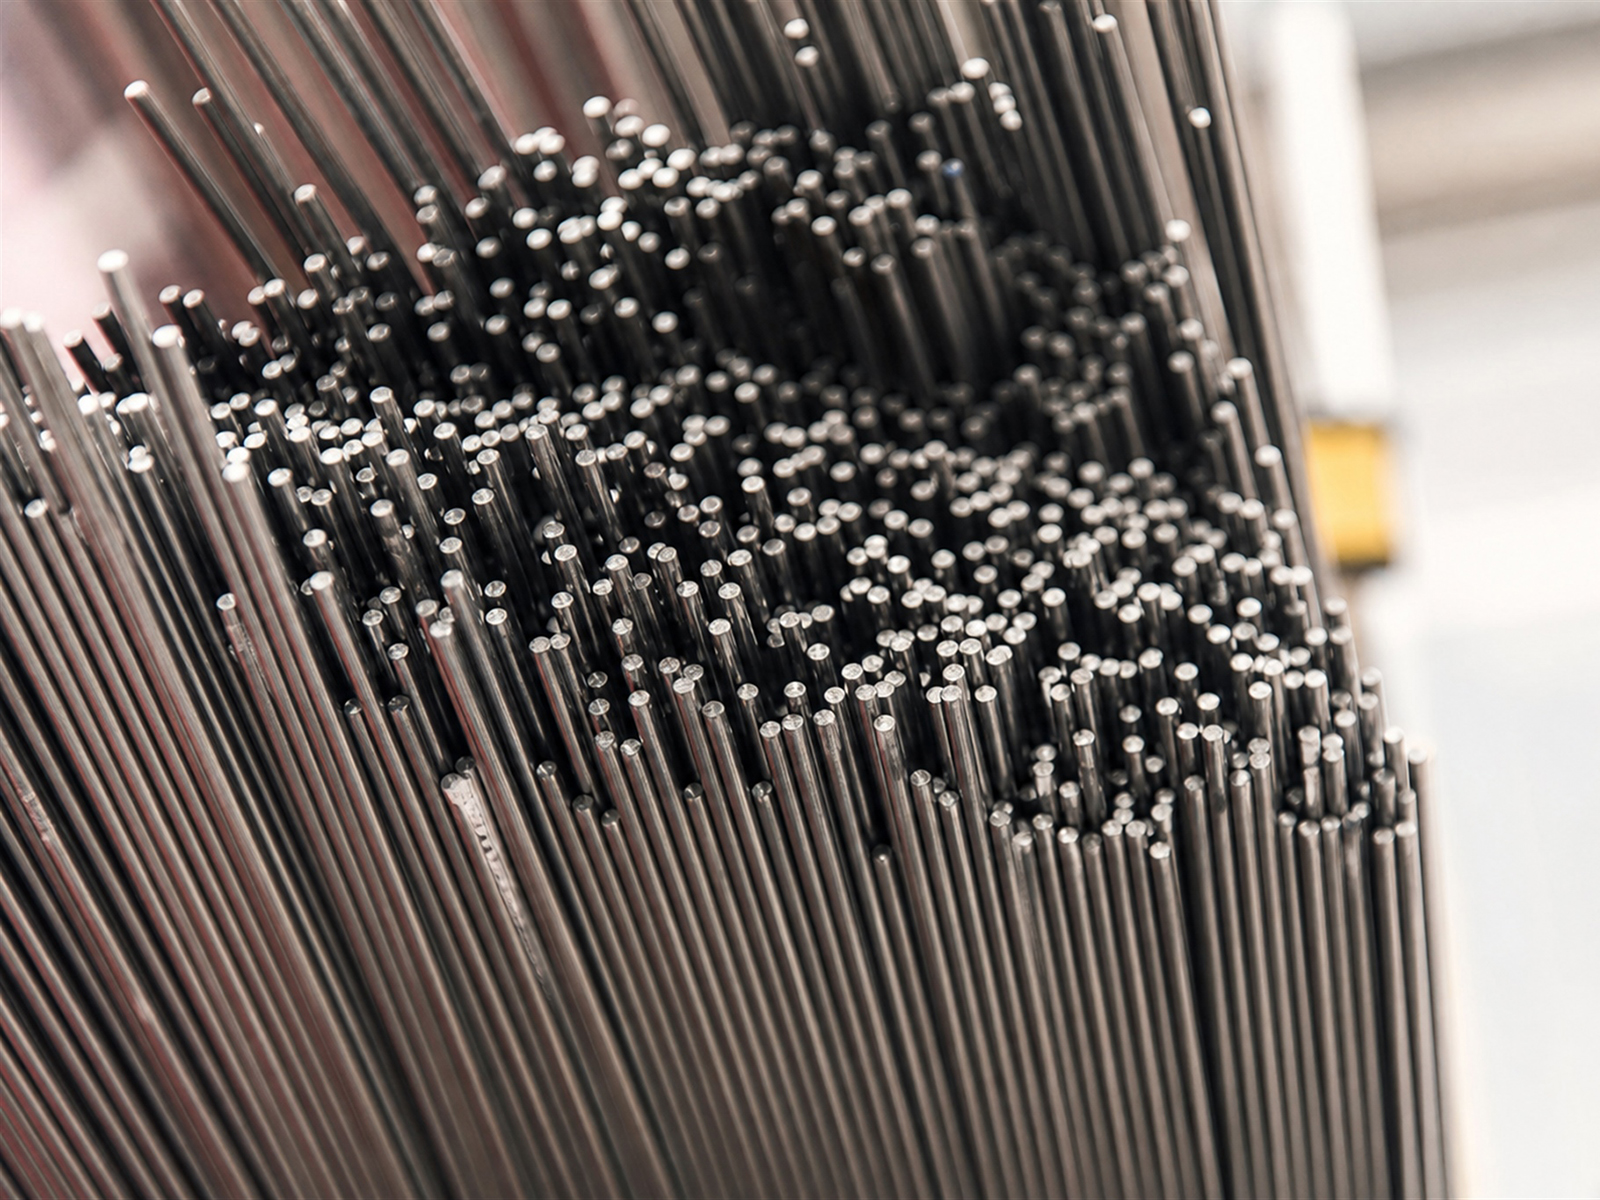
The standard density of GR5 titanium bar is 4.43 g/cm³, a value that demonstrates exceptional specific strength advantages among metallic materials. Compared to steel density of 7.85 g/cm³, GR5 titanium alloy at approximately 56 percent of steel weight maintains comparable strength. This unique density characteristic stems from the alpha-plus-beta dual-phase structure of the Ti-6Al-4V alloy, where aluminum (5.5 to 6.75 percent) reduces density and stabilizes the alpha phase, while vanadium (3.5 to 4.5 percent) stabilizes the beta phase and enhances room-temperature strength.
What Material Science Principles Underlie the Density Data?
Microstructural Characteristics of GR5 Titanium Alloy
The density of Ti-6Al-4V alloy is not a simple elemental mixture result but a macroscopic manifestation of its complex microstructure. Aluminum as an alpha-phase stabilizer reduces overall density while forming hexagonal close-packed crystal lattice (HCP), imparting good creep resistance. Vanadium as a beta-phase stabilizer constructs body-centered cubic structure (BCC), enhancing room-temperature strength while maintaining formability. Through VAR vacuum arc remelting and heat treatment processes, grain structure is refined to uniform distributions, optimizing the balance between density, strength, and toughness.
Precise Correlation Between Density and Alloy Element Content
Subtle changes in alloy composition directly affect final density values. When aluminum content increases from 5.5 to 6.75 percent, density changes minimally (less than 0.02 g/cm³); when vanadium content increases from 3.5 to 4.5 percent, density correspondingly increases by 0.015 g/cm³. Oxygen as an interstitial strengthening element, though not exceeding 0.2 percent, significantly affects lattice parameters. Industrial production employs spectrographic analysis and ICP detection to control chemical composition within strict tolerances, ensuring density consistency across batches.
Influence Mechanisms of Different Processing States on Density
Hot-rolled titanium bars with internal micro-stress and dislocation accumulation may exhibit measured densities fluctuating between 4.41 and 4.43 g/cm³. Annealed bars held at 700 to 850 degrees Celsius with slow cooling achieve grain reorganization eliminating residual stress, stabilizing density at the standard 4.43 g/cm³ value. Cold-drawn bars, though possessing smooth surfaces, may show local density increases of 0.01 to 0.02 g/cm³ due to dislocation density increases from plastic deformation. Proper stress-relief annealing restores density uniformity.
How Does Density Advantage Translate to Value in Practical Applications?
Weight Reduction Economics in Aerospace
A wide-body aircraft model using GR5 titanium alloy to replace high-strength steel for landing gear components achieved 320 kg single-aircraft weight reduction. Calculated at 4.43 g/cm³ density, titanium is 42.5 percent lighter than 440A stainless steel (density 7.70 g/cm³) at equal volume. This weight savings over a 20-year service cycle saves over USD 850,000 in fuel costs while increasing payload or range capability. Turbine engine blades manufactured from GR5 titanium alloy withstand centrifugal loads more effectively than heavier alternatives, enabling higher operating temperatures and improved thrust-to-weight ratios.
Material Type | Density (g/cm³) | Tensile Strength (MPa) | Specific Strength (MPa·cm³/g) | Typical Application |
GR5 Titanium Alloy | 4.43 | At least 895 | 202 | Aerospace structural parts, engine components |
7075 Aluminum Alloy | 2.81 | 570 | 203 | Secondary structures, skin panels |
AISI 4140 Steel | 7.85 | 1080 | 138 | Traditional heavy-duty shafts |
316 Stainless Steel | 8.00 | 520 | 65 | Chemical equipment, marine fasteners |
Biomechanical Matching for Medical Implants
Human cortical bone density is approximately 1.85 g/cm³, trabecular bone 0.6 to 1.0 g/cm³. While GR5 titanium alloy density of 4.43 g/cm³ exceeds bone tissue, its elastic modulus (110 GPa) is far below 316L stainless steel (193 GPa), closer to bone elastic modulus (10 to 30 GPa). This mechanical compatibility reduces stress shielding effect: when implants are too stiff, bone bears less load and undergoes resorption. GR5 titanium implants maintain physiological stress transfer, promoting osseointegration and long-term stability.
Corrosion Resistance Cost-Effectiveness in Marine Engineering
Deep-sea equipment at 3,000 meters water depth withstands 30 MPa hydrostatic pressure; for every 1 g/cm³ density increase, buoyancy chambers require approximately 15 percent additional compensating material. GR5 titanium alloy, maintaining 895 MPa tensile strength, is 45.9 percent lighter than nickel-based alloy Inconel 718 (density 8.19 g/cm³). A deep-submersible project using GR5 titanium alloy for pressure hulls achieved 30 percent weight reduction compared to Ti-6242 titanium alloy alternatives, directly translating to improved diving range and operational flexibility.
How Does the Density Testing and Quality Control System Work?
Standard Testing Methods and Precision Requirements
According to ASTM B311 standard, GR5 titanium bar density is determined using Archimedes water displacement method. Specimens are measured for underwater mass and airborne mass at 20 +/- 1 degrees Celsius in deionized water, calculating density as rho = m₁/(m₁-m₂) x rho_water. High-precision analytical balances (accuracy 0.0001 g) ensure measurement error below 0.01 g/cm³. In industrial production, 3 bars per batch are sampled, with 3 positions per bar (both ends and center) prepared for testing, averaging results for final density determination.
Density Uniformity Control Across Different Diameters
Small-diameter cold-drawn bars (phi 4 to 30 mm) with significant processing deformation require stress-relief annealing at 510 to 650 degrees Celsius to restore organizational uniformity, ensuring axial density differences at most 0.3 percent. Large-diameter forged bars (phi 100 to 300 mm) employ upset-plus-draw multi-heat forging combined with ultrasonic phased array inspection for grain flow continuity. A batch of phi 200 mm x 3,000 mm annealed bars tested at 500 mm intervals along length showed density variation below 0.15 percent, confirming excellent uniformity.
Root Cause Analysis and Prevention of Density Anomalies
Density below 4.40 g/cm³ typically indicates excess alpha stabilizing elements or hydrogen content exceeding specifications. Hydrogen, as the lightest element, at even 50 ppm (standard limit 150 ppm) reduces density by 0.005 g/cm³, more seriously inducing hydrogen embrittlement risk. Density above 4.46 g/cm³ may stem from heavy element contamination (iron, tungsten) or insufficient forging of ingot segregation. A documented case showed abnormal density reaching 4.51 g/cm³ traced to iron contamination from tooling wear during processing, corrected through improved lubrication and tooling materials.
How Does GR5 Titanium Bar Density Compare with Other Titanium Alloys and Metallic Materials?
Density Gradient Distribution Among Pure Titanium and Titanium Alloys
GR1/GR2 pure titanium density reaches 4.51 g/cm³, actually higher than GR5 alloy, due to the light element characteristic of aluminum. However, pure titanium strength of only 240 to 345 MPa cannot meet structural load requirements. GR23 (Ti-6Al-4V ELI) shares similar composition and density with GR5, but achieves superior fracture toughness through controlled interstitial elements (oxygen at most 0.13 percent), making it suitable for human implant applications where maximum toughness is critical.
Grade | Type | Density (g/cm³) | Tensile Strength (MPa) | Elongation (%) | Typical Characteristics |
GR1 | Commercial Pure Titanium | 4.51 | At least 240 | At least 24 | Best corrosion resistance, low strength |
GR2 | Commercial Pure Titanium | 4.51 | At least 345 | At least 20 | General grade, good formability |
GR5 | Alpha-Beta Alloy | 4.43 | At least 895 | At least 10 | High strength, excellentperformance |
GR9 | Alpha-Beta Alloy | 4.48 | At least 620 | At least 15 | Medium strength, cold-formable |
GR23 | Alpha-Beta Alloy | 4.43 | At least 860 | At least 10 | Medical grade, ultra-low interstitial |
Ti-6.5Al-3.5Mo-1.5Zr-0.3Si | Alpha-Beta Alloy | 4.48 | At least 1050 | At least 8 | High strength-toughness, 450 degrees C service |
Density Comparison with Traditional Metallic Materials
Among structural metals, GR5 titanium alloy achieves the optimal balance of strength-to-weight ratio. Aluminum alloys (7075-T6, density 2.81 g/cm³) offer lower density but inferior corrosion resistance and elevated temperature performance. Steel alloys (AISI 4140, density 7.85 g/cm³) provide higher absolute strength but at more than double the weight. Nickel-based superalloys (Inconel 718, density 8.19 g/cm³) excel at extreme temperatures but are prohibitively heavy for weight-sensitive applications. GR5 titanium uniquely bridges the gap between lightweight aluminum and high-strength steel, offering corrosion resistance neither can match.
How Is Density Data Traced and Verified in the Supply Chain?
Interpreting Density Information in Material Certificates
Standard material test certificates (MTC) should include measured density values, testing methods, and sampling locations. A certificate for a phi 80 mm x 3,000 mm annealed bar batch showed: density 4.428 g/cm³ (ASTM B311 method), sampled 500 mm from bar end, specimen size phi 10 mm x 50 mm. Customer re-testing upon receipt confirmed 4.431 g/cm³, a deviation of 0.07 percent within acceptable range. Third-party testing laboratories provide independent verification for critical applications.
Rapid Screening Technologies for Density Anomalies
Ultrasonic longitudinal wave velocity correlates with density and elastic modulus; for GR5 titanium alloy, velocity is approximately 6,080 m/s. Portable ultrasonic thickness gauges can indirectly assess density: when sound velocity drops below 6,000 m/s, porosity or inclusions may be present. Eddy current testing exploits conductivity differences; density anomaly regions with compositional segregation cause conductivity variations, with eddy current signal amplitude deviations exceeding 10 percent from baseline warranting re-inspection. Integrated screening systems combining ultrasonic, eddy current, and X-ray technologies enable rapid non-destructive density assessment.
Customer Acceptance Standards and Dispute Resolution
In international trade, buyers and sellers must clarify density acceptance criteria. Aerospace customers typically require density between 4.42 and 4.44 g/cm³; medical customers accept 4.40 to 4.46 g/cm³; chemical industry tolerances are wider. A documented case involved a customer rejecting material at 4.39 g/cm³ density while supplier re-testing showed 4.428 g/cm³. The dispute originated from testing temperature differences (customer 15 degrees C, supplier 20 degrees C) and balance calibration discrepancies, resolved through standardized re-testing at 20 degrees Celsius per ASTM B311.
Conclusion
The density of 4.43 g/cm³ for GR5 titanium bar is the result of precise balance between microstructure and chemical composition in the Ti-6Al-4V alloy system. This characteristic endows the material with exceptional specific strength advantages and broad application scope. From aerospace weight reduction to medical implant biocompatibility, from deep-sea equipment pressure resistance to precision machinery stability, the scientific principles and engineering value embedded in density numbers span the entire chain from material selection, design, processing, to acceptance. Understanding density data empowers engineers to make informed material choices optimized for performance, weight, and cost.
FAQ
Q1: Why Is GR5 Titanium Alloy Density Lower Than Pure Titanium?
Approximately 6 percent aluminum in GR5 alloy has density of only 2.70 g/cm³, significantly lower than titanium 4.51 g/cm³. Weighted calculation by mass fraction reduces alloy density to 4.43 g/cm³. Aluminum simultaneously stabilizes the alpha phase structure while reducing density, achieving both lightweighting and elevated temperature performance—a textbook example of materials composition optimization.
Q2: How to Handle Density Test Result Deviations?
Immediately verify testing conditions comply with ASTM B311 standard: check temperature (should be 20 +/- 1 degrees C), specimen surface preparation (oxide scale must be removed), and balance calibration status. If deviation exceeds +/-0.02 g/cm³, conduct chemical composition analysis and metallographic inspection to exclude material defects. Multi-point sampling and repeated measurements averaging reduce random errors.
Q3: Do Different Surface Conditions Affect Titanium Bar Density?
Black-skin surface oxide layer thickness of 5 to 50 micrometers has density approximately 4.2 g/cm³ (primarily TiO₂), but this affects only the surface layer; base material density remains 4.43 g/cm³. Pealed and ground surfaces remove the oxide layer, yielding measured density closer to true values. For precision density testing, pealed specimens should be used, or oxide layer mass deducted in calculations to ensure data accuracy.
Finding a High-Quality GR5 Titanium Bar Supplier
Baoji Titanium Valley Titanium Nickel Zirconium Material Processing Co., Ltd., as a professional manufacturer, operates Italian Danieli rolling production lines with annual precision titanium bar output of 20,000 tons. Density control accuracy is +/-0.01 g/cm³ with full-batch material certificates traceable. Full specification customization from phi 4 to 300 mm is available, meeting aerospace ASTM, medical ISO, and chemical ASME standards. Contact us for technical consultation: sales@titaniumvalleys.com
For a broader view of available grades, supply forms, and related specifications, explore our Titanium Rod category.
For product-level details and supply options, you can also review our ASTM F136 Gr5 Eli (Gr23) Titanium Rod page.
References
Zhao Yongqing, Zeng Weidong. Titanium Alloy Phase Transformation and Heat Treatment [M]. National Defense Industry Press, 2018.
Yang Guanjun, Li Xiang. Titanium Alloy Handbook [M]. Chemical Industry Press, 2012.
Li Miaoquan, Zhang Yongqiang. Aerospace Titanium Alloy Materials and Applications [M]. Aviation Industry Press, 2020.
Wang Jinyou. Titanium Alloy Materials and Their Applications [M]. Machinery Industry Press, 2014.